You’ve approved the $80,000 LMS investment. Your CEO expects results. By Month 4, without visible revenue impact, people start wondering if it was a mistake.
Here’s what most vendors won’t tell you: LMS ROI doesn’t appear all at once. It arrives in waves, and if you’re not expecting it, you’ll kill the project before the big benefits show up.
This guide shows exactly when each benefit materializes – month by month – plus the five critical mistakes that make 40% of LMS ROI calculations fail.
Quick Answer: LMS ROI Timeline at a Glance
| Timeline | What You’ll See | ROI Impact |
|---|---|---|
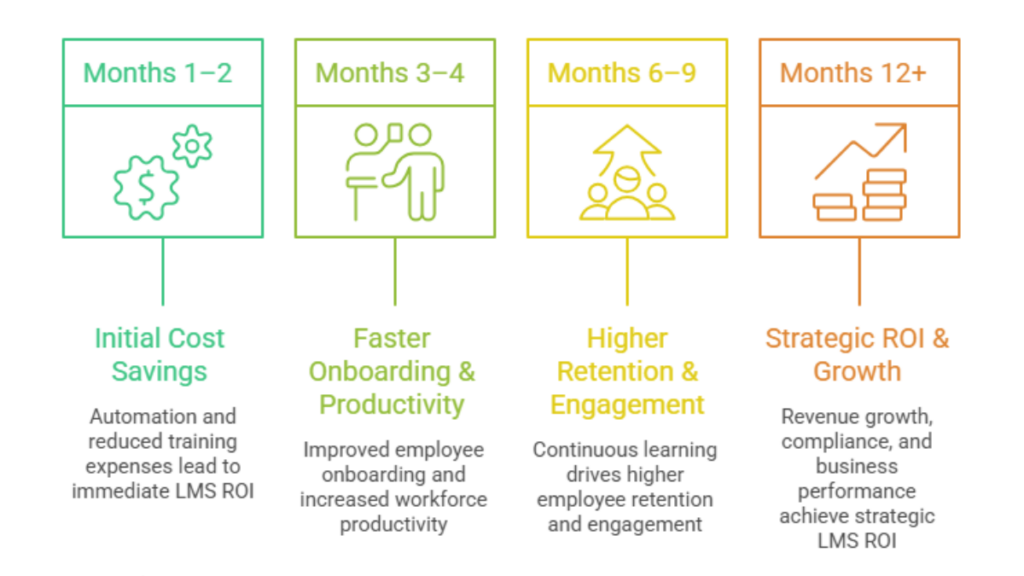
| Months 1-2 | Travel & admin savings (immediate) | 15-25% of LMS cost recovered |
| Months 3-4 | Productivity gains (onboarding, trainer efficiency) | Additional 10-15% |
| Months 6-9 | Retention improvements visible (engagement data) | Additional 20-30% |
| Months 12+ | Revenue, compliance, performance ROI | 50-100%+ additional |
The critical insight: 40% of orgs see NO ROI because they abandon the project at Month 4-6, before long-term benefits appear.
The LMS ROI Timeline: Month-by-Month Reality
Months 1-2: Immediate Wins
Travel elimination, automated enrollment, and materials reduction create quick savings. Expect $12,000-$20,000 (15-25% of investment) in the first two months.
Example: Eliminating 10 monthly in-person training sessions = $35,000-$50,000 annual travel savings.
This momentum is psychologically critical—leadership sees the LMS is creating value.
Months 3-4: Productivity Gains Emerge
New hires reach full productivity 2-4 weeks faster. Training teams stop repeating the same live session repeatedly.
Example: New hire reaches productivity 2 weeks faster × $1,923/week salary value × 10 new hires = $38,460 productivity gain.
Add $8,000-$12,000 here, bringing cumulative recovery to 35-40% of investment.
Months 6-9: Retention ROI Becomes Visible
Employee satisfaction with learning improves. Attrition rates begin shifting (though turnover data lags 4-6 months).
Example: Retaining 2 employees saves 2 × $40,000 = $80,000 in prevented turnover costs.
Critical moment: This is when most orgs abandon LMS projects. Travel savings have faded from conversation. Productivity gains are questioned. Retention benefits aren’t fully visible yet. But patience here is rewarded exponentially.
Months 12+: Strategic ROI Multiplies
Sales training ROI (improved win rates), compliance cost avoidance (prevented penalties), and performance improvements compound.
Example (Sales): 20 sales reps × $500K deal size × 3% win rate improvement = $300,000 additional revenue.
Example (Compliance): 1 prevented employment lawsuit (avg. $490,000) × 1 lawsuit prevented per 100 employees trained = $490,000 cost avoidance.
By Month 12, cumulative ROI often exceeds 100%.
Why Most LMS ROI Calculations Fail (5 Critical Mistakes)
Mistake #1: Measuring Wrong Metrics at Wrong Time
You can’t measure revenue lift at Month 2 or retention improvement at Month 3—these metrics take 6-12 months to appear.
Fix: Agree on metric timeline upfront. Month 1-2: travel/admin. Month 3-4: productivity. Month 6-9: retention. Month 12+: revenue/compliance.
Mistake #2: Attribution Overreach
You claim 100% of productivity improvement comes from LMS. Reality: hiring quality, manager coaching, and new tools also contributed.
Fix: Use conservative attribution. If you believe LMS contributed $100K to productivity, report $50K-$75K as LMS ROI.
Mistake #3: Hidden Implementation Costs
Budget $50K software cost; actual spend $100K (content migration, customization, admin time).
Fix: Budget 2-3x the software cost for total Year 1 investment.
Mistake #4: Low Adoption Kills ROI
You deploy LMS to 500 employees; only 40% actively use it. No adoption = no ROI, period.
Healthy adoption ramp: 30% Month 1 → 50% Month 3 → 70% Month 6 → 85% Month 12.
If adoption plateaus below 50% at Month 3, escalate immediately.
Mistake #5: Giving Up Too Early
At Month 4-6, the CFO pressures you to cancel. You do. You miss Months 6-12, when 50-70% of cumulative ROI appears.
Fix: Commit to 12-month measurement window upfront. Organizations that stick to Month 12 see 2-3x better outcomes.
Industry Breakdown: ROI Varies Dramatically
Healthcare: 60-70% of ROI from compliance cost avoidance (penalties prevented, audits passed). Realistic Year 1 ROI: 40-60%.
Retail/Hospitality: 70-80% of ROI from retention improvements (reduce 50% annual turnover). Realistic Year 1 ROI: 75-120% (highest of all verticals).
Manufacturing: Safety incident prevention worth $50K-$500K+. One prevented incident often exceeds entire LMS cost. Realistic Year 1 ROI: 100-200%+.
Financial Services: Regulatory compliance (AML, GDPR) + sales training. Realistic Year 1 ROI: 50-80%.
Tech/SaaS: Time-to-productivity is competitive advantage. Realistic Year 1 ROI: 80-150%.
| Industry | Primary Benefit | Year 1 Realistic ROI | Timeline to Break-Even |
|---|---|---|---|
| Healthcare | Compliance avoidance | 40-60% | 14-18 months |
| Retail | Retention | 75-120% | 8-12 months |
| Manufacturing | Safety | 100-200% | 6-10 months |
How to Build Your Realistic Timeline (4 Steps)
Step 1: Define ROI Metrics Before Launch
Answer: What metrics prove success? (travel savings? retention? revenue?) What’s realistic timeline for each? What’s minimum acceptable ROI?
Step 2: Capture Baseline Metrics (Month 0)
Measure: current training costs, onboarding time, attrition rate, compliance violations. You need before/after comparison.
Step 3: Track Monthly; Adjust Expectations
Month 1-2: Are you seeing travel savings?
Month 3: adoption 50%+? Month 6: retention trending down? Monthly tracking prevents surprises at Month 12.
Step 4: Communicate to Leadership Monthly
Month 1: “Travel savings working; give us months to see bigger benefits.”
Month 6: “On track; retention metrics becoming visible; 6 more months needed.”
Month 12: “Full ROI: $118K on $80K investment = 148%.”
Monthly reporting prevents de-funding at Month 6 (the biggest killer of LMS ROI).
Conclusion
LMS ROI requires three things:
- Patience — 12-month measurement window (not 6)
- Discipline — Month-by-month tracking and reporting
- Honesty — Conservative attribution and realistic expectations
60% of organizations that follow this roadmap hit or exceed targets. That’s better odds than most business investments.
Next steps:
- Month 0: Define ROI metrics. Capture baseline.
- Months 1-12: Track monthly. Report to leadership monthly.
- Month 12: Calculate full Year 1 ROI. Plan Year 2 (benefits compound).
The organizations that nail LMS ROI do these three things. The ones that miss do none.
FAQ: Common Questions
Q: Can I calculate ROI before Month 12?
A: Month 6 gives interim forecast (visible benefits only). Month 12 gives full picture (after long-term benefits appear). Use Month 6 to assess direction; Month 12 for final judgment.
Q: What if adoption is low?
A: Low adoption kills ROI. If adoption <50% at Month 3, diagnose: manager enforcement lacking? Course quality poor? Fix immediately or ROI is dead.
Q: What % of orgs hit ROI targets?
A: 60% hit or exceed targets. 40% miss due to low adoption (35%), hidden costs (25%), weak measurement (20%), unrealistic expectations (15%).
Q: Should I wait 12 months or can I pull the plug early?
A: Month 6 is checkpoint. Month 12 is final. Only abandon if adoption <40% AND costs overrun AND fixes don’t work.